Produces a ggplot2 map for rapid exploratory visualisation.
Arguments
- x
An sf object.
- fill
Character. Column name to use as fill variable. NULL (default) produces an outline map.
- title
Character. Map title. NULL for no title.
- palette
Character. Viridis palette option. One of "viridis" (default), "magma", "plasma", "inferno", or "cividis".
- breaks
Numeric vector. Custom legend break points. NULL (default) lets ggplot2 choose automatically.
- ...
Additional arguments passed to
ggplot2::geom_sf().
Value
Returns a ggplot object (class "gg" and "ggplot") representing a choropleth map.
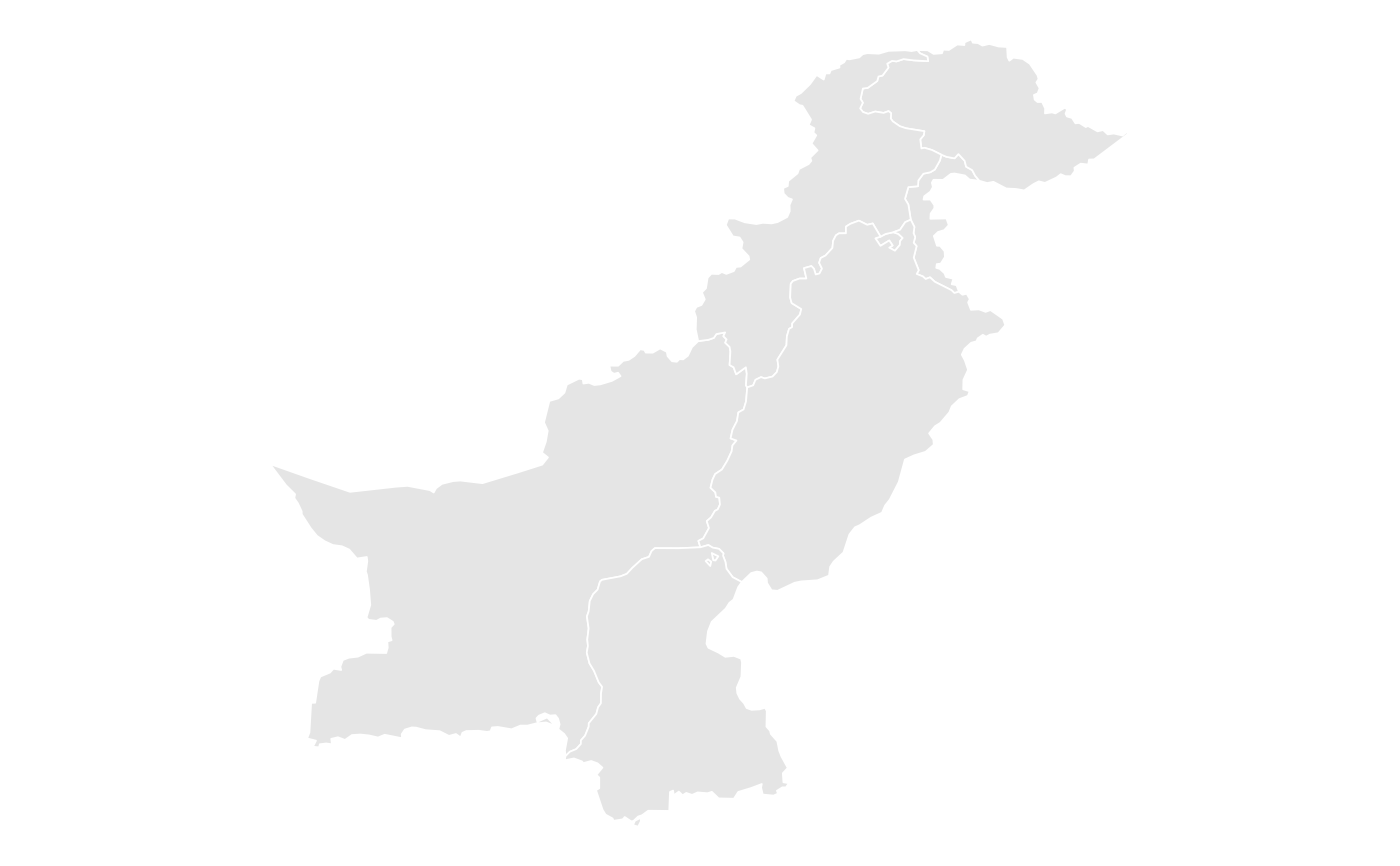
When fill = NULL, the output is an outline map with grey90 fill
and white borders, useful for context or reference.
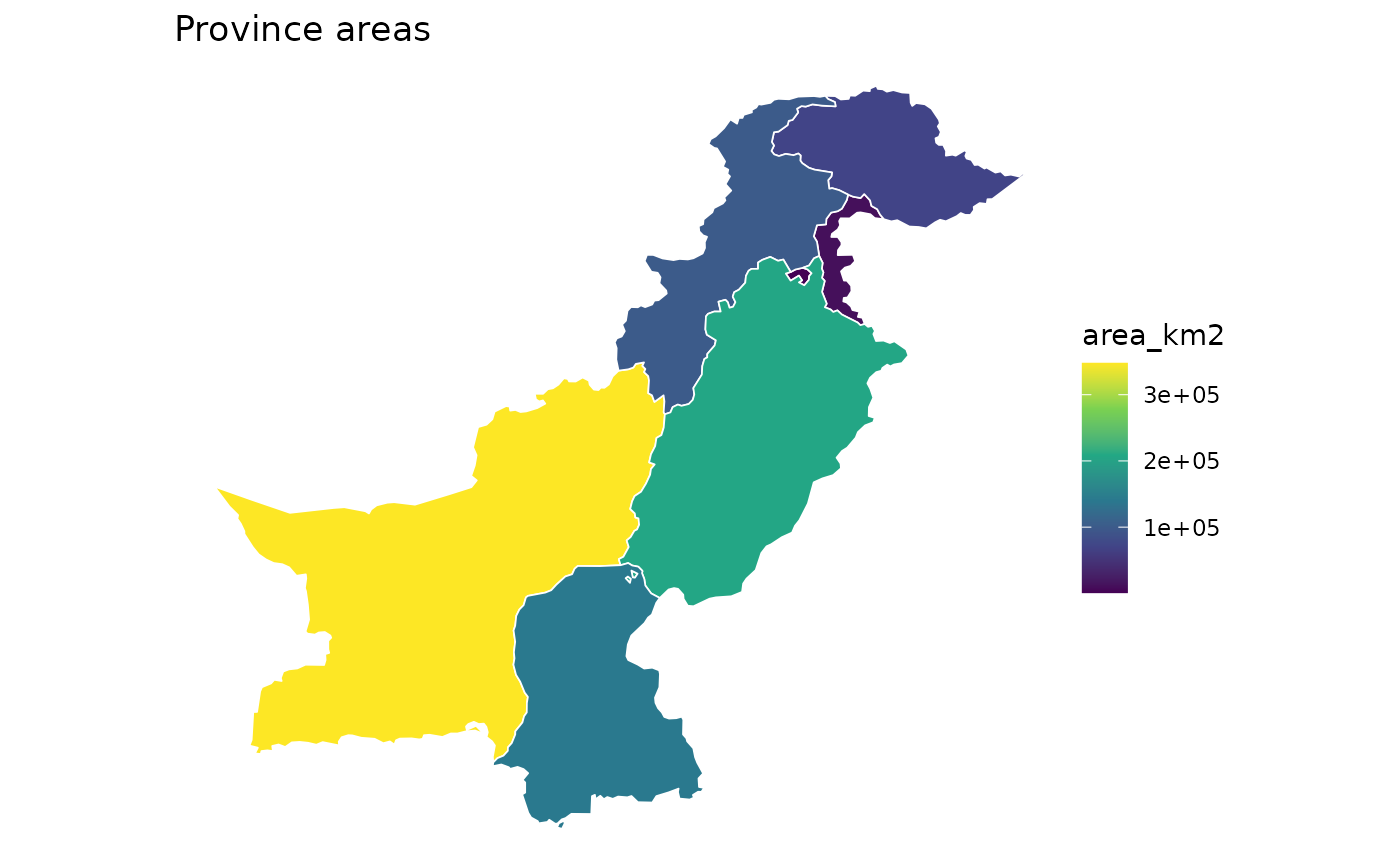
When a fill variable is provided, the output uses a viridis color
scale with automatic legend, for visualizing spatial distributions
of continuous variables (e.g., area, population, density).
The returned ggplot object can be extended with additional layers, themes, or scales using standard ggplot2 syntax.
Examples
# Outline map of provinces
pk_map(get_provinces())


# Choropleth map with fill variable
pk_map(get_provinces(), fill = "area_km2", title = "Province areas")
# Choropleth map with fill variable
pk_map(get_provinces(), fill = "area_km2", title = "Province areas")